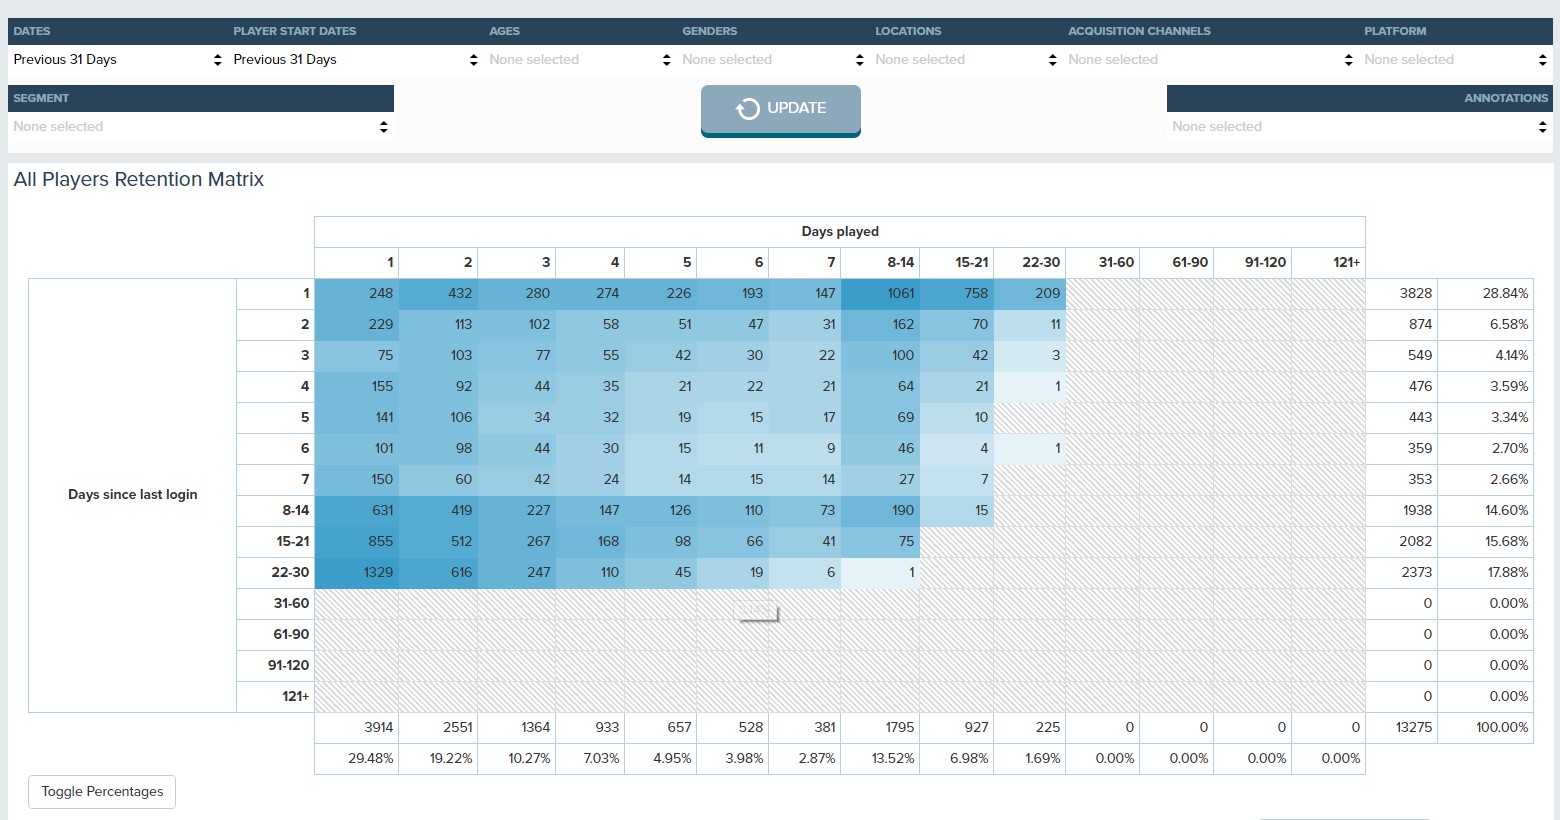
The All Player Retention chart will show you how many players have played for a certain number of days across the game's lifespan. These days do not need to be consecutive, it could be across a large period (or the whole lifespan of the game). Using the chart below you'll see that 248 players have played for one day since logging in one day ago.
The All Players Retention Matrix can give you an idea of the total number of days players tend to spend in the game before churning.
New Player Retention will show how many players return on exactly N days after installing. This is the classic user retention metric which is used as a major KPI across the industry.
In the following example we have 2206 people who installed and 1006 people who came back on day 1; 1006/2206*100 = 45.60. For day 2 however we see 664 people coming back: 664/2206*100 = 30.01 which is not what we see in the matrix. The reason for this is that people installing on the 25th haven't had the chance to come back on their second day yet since that is the 27th, tomorrow. Therefore we don't consider the installs of the 25th for day 2 retention totals: (664/(2206-179)*100) = 32.76.

The first chart allows you to see how many times players are playing, whereas the second one tracks how quickly they are coming back after they've first installed it.